
From ICECAP [click for the complete post]:
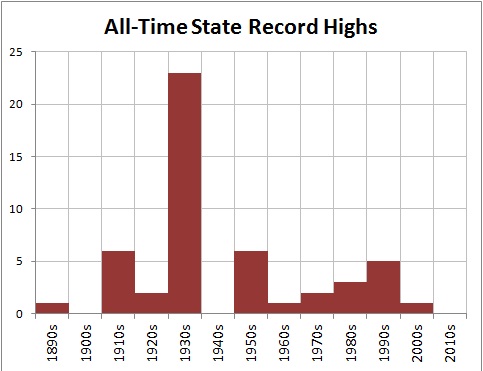
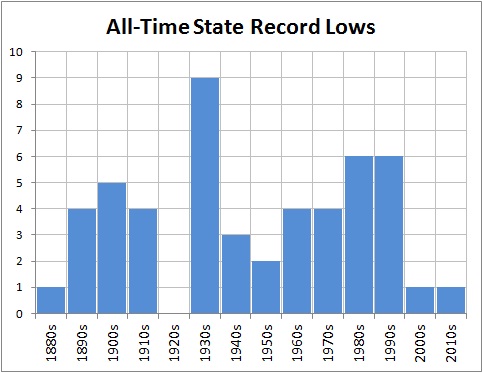
Here by the way is the state all time record highs and lows since 1880s. See any of Cullen or Romm or Meehl’s tipping point runaway warming?


ALSO SEE: Jun 09, 2012
Records and Extremes
Thanks for this update, Joe D'Aleo.
In order to understand better the significance of these charts, I recommend that you read the whole post from 2-years ago at Climate Science. Here is an excerpt:
1. The data are not adjusted. They are recognized as valid by NOAA and have not been “corrected” by interpolation with data from other weather station data.
2. They represent the climate “boundaries” for statewide geographies. A record either stands on it’s own or is replaced by a subsequent reading that ties or exceeds it.
3. It allows testing of the tenet that global warming necessarily results it an increased frequency of temperature extremes.Anthony Watts has identified other types of "corrected" data that are avoided in the above data.