READ ABOUT DETROIT AND SOLUTIONS TO ITS PROBLEMS. CLICK HERE.

Wednesday, February 04, 2009

How Are We To Measure Global Warming

SEARCH BLOG: GLOBAL WARMING

Why is there so much controversy about global warming? Is the world warming or isn't it? How much more direct can a question be? Then why can't we get agreement on whether it is happening or not?

Well, for one thing, measuring global temperature change is not like measuring the distance between two points on a table. The two dimensional metric of measuring two points distance is insignificant compared with measuring the three dimensional atmosphere and ocean temperatures and heat content.

The first question is what are we measuring? From the very start there is little agreement....

  • Surface temperatures versus complete atmospheric temperatures
  • Land temperatures versus ocean temperatures
  • Ocean surface temperatures versus ocean heat content to 700m.
How are temperatures to be measured AND UNDER WHAT CONDITIONS?
  • Satellite readings
  • 6 ft. above ground thermometers [calm, windy, sunny, cloudy, rainy, dry]
  • Ocean surface buoys [current conditions/direction]
  • Ocean buoys at various depths [circulating versus non-circulating water]
What constitutes a measurement?
  • 1 time per day, 2, 24, continuous readings per day
  • randomly or evenly dispersed readings geographically [grid vs. sporadic]
What quality control/calibration variances/accuracies are acceptable?
  • Daily, monthly, quarterly, annual calibration
  • > 0.1°, >0.5°, >1.0°, >3.0°
  • Electronic vs. manual readings
For what reasons will measurements be adjusted and in what manner?
  • Disagreement with nearby sites
  • Time of day for readings
  • Artificial heat sources
  • Relocation of a site
  • Specific adjustment versus general formula
What is the definitive metric?
  • High temperature/average of high temperatures/record high temperatures
  • Low temperatures/average of low temperatures/record low temperatures
  • Daily average of maximum/minimum/record daily average
  • Average of continuous readings/record average [per period]
  • Variance from historical average [variable 30-year period/all recorded history]
What is an appropriate time period for determining significant change?
  • The last 30-years [to establish normal?]
  • Since 1880 [why start in a recognized cold period?]
  • Since the last ice age [what are the bases for measurement and how can they be made consistent?]
  • Geological eras [does trend variability over a century that is less than annual average temperature variability mean anything significant?]
What constitutes record temperatures?
  • Maximum/minimum for a day
  • Maximum/minimum for a month
  • Average monthly temperatures [max/min or continuous?]
  • Average annual temperatures [max/min or continuous?]
_________________________

Once everyone agrees on the answers to all of the above, then we can have a rational discussion about whether the temperature history [as agreed upon] indicates global warming, global cooling, or climate oscillations within an expected variation.

For those who argue that using monthly, statewide, all-time, maximum and minimum records does not meet an acceptable analytical standard, I will only point out the following:
  • the data have not been adjusted on the basis of estimated correction factors for specific locations
  • the data cover more than a small geographic area and are not as impacted by unusual circumstances as a single site
  • the data average roughly a 30-day span for each record and are not as impacted by random day-to-day readings... not entirely seasonal, but not restrictively short
  • the data establish the temperature boundaries for large areas/regions versus micro-climate boundaries
There are many who want to see Littletown's record for the 23rd of May be recognized. The question is whether that micro-climate record is meaningful in the larger picture.
A single statewide record could be nothing more than an extreme event, but 113 statewide records in a decade is an extreme decade covering a large area. The fact that those 113 records in the 1930s [about 19% of all records from all years] have stood for 70-80 years is a pretty good indication that the more sporadic incidents of records subsequently have been related to minor climate oscillations... comparatively.
I'll stand by my statewide, monthly, all-time temperature records as being as meaningful as any other metric in judging climate change... at least for the U.S. where there have been long-term observations over a large geographic area. I would interpret a 1° trend increase over 130 years from a low starting point as essentially irrelevant... given the absence of a significant concentration of extreme temperature records currently. It is more likely that the trend can be solely attributed to the low starting point and nearly every other change has been variation within the general upper limit defined by the 1930s.

RELATED:

MONDAY, JANUARY 19, 2009Where Is The Global Warming... Extreme Temperature Records Update January 2009
..

Can"t Find It?

Use the SEARCH BLOG feature at the upper left. For example, try "Global Warming".

You can also use the "LABELS" below or at the end of each post to find related posts.

Blog Archive

Cost of Gasoline - Enter Your Zipcode or Click on Map

CO2 Cap and Trade

There is always an easy solution to every human problem—neat, plausible, and wrong.
Henry Louis Mencken (1880–1956)
“The Divine Afflatus,” A Mencken Chrestomathy, chapter 25, p. 443 (1949)
... and one could add "not all human problems really are."
It was beautiful and simple, as truly great swindles are.
- O. Henry
... The Government is on course for an embarrassing showdown with the European Union, business groups and environmental charities after refusing to guarantee that billions of pounds of revenue it stands to earn from carbon-permit trading will be spent on combating climate change.
The Independent (UK)

Tracking Interest Rates

Tracking Interest Rates

FEDERAL RESERVE & HOUSING

SEARCH BLOG: FEDERAL RESERVE for full versions... or use the Blog Archive pulldown menu.

February 3, 2006
Go back to 1999-2000 and see what the Fed did. They are following the same pattern for 2005-06. If it ain't broke, the Fed will fix it... and good!
August 29, 2006 The Federal Reserve always acts on old information... and is the only cause of U.S. recessions.
December 5, 2006 Last spring I wrote about what I saw to be a sharp downturn in the economy in the "rustbelt" states, particularly Michigan.
March 28, 2007
The Federal Reserve sees no need to cut interest rates in the light of adverse recent economic data, Ben Bernanke said on Wednesday.
The Fed chairman said ”to date, the incoming data have supported the view that the current stance of policy is likely to foster sustainable economic growth and a gradual ebbing in core inflation”.

July 21, 2007 My guess is that if there is an interest rate change, a cut is more likely than an increase. The key variables to be watching at this point are real estate prices and the inventory of unsold homes.
August 11, 2007 I suspect that within 6 months the Federal Reserve will be forced to lower interest rates before housing becomes a black hole.
September 11, 2007 It only means that the overall process has flaws guaranteeing it will be slow in responding to changes in the economy... and tend to over-react as a result.
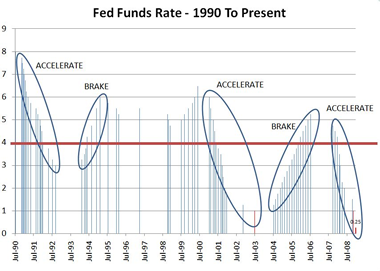
September 18, 2007 I think a 4% rate is really what is needed to turn the economy back on the right course. The rate may not get there, but more cuts will be needed with employment rates down and foreclosure rates up.
October 25, 2007 How long will it be before I will be able to write: "The Federal Reserve lowered its lending rate to 4% in response to the collapse of the U.S. housing market and massive numbers of foreclosures that threaten the banking and mortgage sectors."
November 28, 2007 FED VICE CHAIRMAN DONALD KOHN
"Should the elevated turbulence persist, it would increase the possibility of further tightening in financial conditions for households and businesses," he said.

"Uncertainties about the economic outlook are unusually high right now," he said. "These uncertainties require flexible and pragmatic policymaking -- nimble is the adjective I used a few weeks ago."
http://www.reuters.com/

December 11, 2007 Somehow the Fed misses the obvious.
fed_rate_moves_425_small.gif
[Image from: CNNMoney.com]
December 13, 2007 [from The Christian Science Monitor]
"The odds of a recession are now above 50 percent," says Mark Zandi, chief economist at Moody's Economy.com. "We are right on the edge of a recession in part because of the Fed's reluctance to reduce interest rates more aggressively." [see my comments of September 11]
January 7, 2008 The real problem now is that consumers can't rescue the economy and manufacturing, which is already weakening, will continue to weaken. We've gutted the forces that could avoid a downturn. The question is not whether there will be a recession, but can it be dampened sufficiently so that it is very short.
January 11, 2008 This is death by a thousand cuts.
January 13, 2008 [N.Y. Times]
“The question is not whether we will have a recession, but how deep and prolonged it will be,” said David Rosenberg, the chief North American economist at Merrill Lynch. “Even if the Fed’s moves are going to work, it will not show up until the later part of 2008 or 2009.
January 17, 2008 A few days ago, Anna Schwartz, nonagenarian economist, implicated the Federal Reserve as the cause of the present lending crisis [from the Telegraph - UK]:
The high priestess of US monetarism - a revered figure at the Fed - says the central bank is itself the chief cause of the credit bubble, and now seems stunned as the consequences of its own actions engulf the financial system. "The new group at the Fed is not equal to the problem that faces it," she says, daring to utter a thought that fellow critics mostly utter sotto voce.
January 22, 2008 The cut has become infected and a limb is in danger. Ben Bernanke is panicking and the Fed has its emergency triage team cutting rates... this time by 3/4%. ...

What should the Federal Reserve do now? Step back... and don't be so anxious to raise rates at the first sign of economic improvement.
Individuals and businesses need stability in their financial cost structures so that they can plan effectively and keep their ships afloat. Wildly fluctuating rates... regardless of what the absolute levels are... create problems. Either too much spending or too much fear. It's just not that difficult to comprehend. Why has it been so difficult for the Fed?

About Me

My photo
Michigan, United States
Air Force (SAC) captain 1968-72. Retired after 35 years of business and logistical planning, including running a small business. Two sons with advanced degrees; one with a business and pre-law degree. Beautiful wife who has put up with me for 4 decades. Education: B.A. (Sociology major; minors in philosopy, English literature, and German) M.S. Operations Management (like a mixture of an MBA with logistical planning)