What's Normal?
SEARCH BLOG: CLIMATE or WEATHER or OSCILLATIONS
NOAA [National Oceanographic and Atmospheric Administration] published two charts for February both showing variances from normal:


Based on my sampling, I'd guess that NOAA uses some sort of smoothing technique? when drawing the Departure from Normal map [middle] because our suburban Detroit area had over a -4°F average variance from normal [click on map immediately above], but on the Departure from Normal it is shown in the 0 to -2 range.What caught my eye was the difference between the Climate at a Glance and the Departure from Normal maps. Here in Michigan, most people will say that this February was very similar to those in the early 70s when temperatures seemed colder than "normal." Yet the Climate at a Glance shows Michigan as "near normal'. What is different is that NOAA uses temperature records going back to 1895 for their climate analysis and records going back to 1971 for their normal baseline.
NOAA also states that they use adjustment techniques for the temperatures used in the normal calculation, but I'm not sure if those same techniques go back to the 1895 data used in the calculation of the other normal.Regardless, I was curious about what constituted normal for the Climate at a Glance maps, so I did a quick sampling of February temperatures for Michigan at the decade breaks and came up with this:
1900 ____16.3While the sampling average of 20.5° F may not be Michigan's actual overall average for 1895-2008, there is an interesting pattern that shows an oscillation more than a trend. I have argued this point before when looking at the pattern of the number of statewide high temperature records for the nation. I acknowledge that this is a small sampling, but it seems to be in agreement with other looks at U.S. climate reporting.
1910 ____17.9 <---
1920 ____16.5
1930 ____26.9
1940 ____21.7
1950 ____20.0
1960 ____21.3
1970 ____18.3 <---
1980 ____17.6
1990 ____24.0
2000 ____26.8
2008 ____18.4 <--- [ranked 41st coldest out of 114 Februarys]
Average ____20.5
Furthermore, what is the criteria for NOAA stating that a particular month's average temperature is near normal versus above normal or below normal? ......What's Normal?Other thoughts...
How, for example, can a month that is barely out of the lower third of recorded averages [Feb. 2008 - 41 of 114 is 36th percentile] be "near normal" on a scale that includes 7 categories?
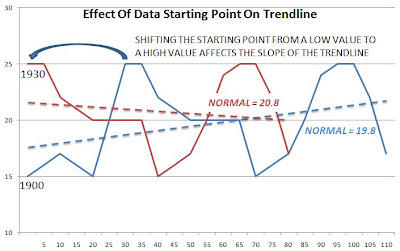
- If we start the temperature series in 1930 instead of 1895 or 1971 [cold points] would our perception of normal and trend be different? The obvious retort is that we use the earlier starting point because we happen to have data going back to the 1890s and it just happens to be a colder period.
Then why have two starting points and why 1971... also a colder period? Why not 1951... a more normal time?[ILLUSTRATIVE DATA ONLY]
- If we use raw data instead of adjusted data would the results be markedly different?
- If we insist on the same weather stations for the entire period used in the calculation of normal, would the results be different?
- If all weather stations had to be maintained to official specifications, would the results be different?
One might ask if the increasing impact of Urban Heat Island [UHI] effect has caused an overstatement... over 113 years... in the average temperatures being reported. There are a lot of sources who say that it has.
Even a 1° increase in reported temperatures due to small towns becoming suburbs and suburbs becoming part of large cities may have a significant impact in the analysis of what is normal. Remember... temperatures will be cooler in the outlying areas, in case you haven't heard that lately on your local weather forecasts.Meanwhile, today's forecasted high around here is 38°F ... about 12° below the normal high temperature... but we might have some above normal temperatures by the end of the month. Oh, and after years of high sunspot activity, the sunspots are virtually absent... and el Nino's warmth has turned into la Nina's cold. Just more of the same changes that happened before.
But that's normal.
What doesn't seem normal is panic about a possible [but questionable] trend change of 1° over 100 or so years... or spending trillions of dollars to prevent a possible cause of a possible change...


