READ ABOUT DETROIT AND SOLUTIONS TO ITS PROBLEMS. CLICK HERE.

Monday, May 14, 2007

More High Temperature Extremes

SEARCH BLOG: GLOBAL WARMING

Craig James, a blogger at WOOD TV in Grand Rapids, Michigan picked up on a couple of my posts regarding the lack of new high temperature extremes in the U.S.

This created some animated comments including one from a person who only identified himself as "gingles." He was having a difficult time with the idea of using only state high temperature records rather than daily high temperature records from all reporting locations. He couldn't see how only 600 possible records in the U.S. could show anything.

Well, there are those who don't like the idea of a sample representing a larger population, but this is an approach used in many areas of life... from politics to medicine. Let's examine the issues:

  • only 600 records

    Annual Possible Records "Normal" Annual Number of Records (120 year average)
    Monthly State Records 600 5
    Daily State Records 18,250 152
    Monthly Reporting Station Records 342,000 2,850
    Daily Reporting Station Records 10,402,500 86,688

    • 50 states times 12 months are 600 possible records. The number of states and months remains consistent and I must presume that even Alaska and Hawaii had temperatures recorded as far back as 1880... although they did not become states until 1959.

    • Records that tie existing records are credited to the last occurrence, which bias the record count toward the latter years.

    • monthly records represent the outcome of the total population of month high readings over 120 years... 72,000 possible opportunities to set a record... with each year having the same opportunity to set a record. While the opportunity to set a record is relatively high when there are few years in the dataset, with 120 years, there is virtually no bias for when in the sequence a year's data was recorded... first and last have the same chance to set and retain a record.

    • using daily records for states might change the outcomes somewhat, but probably not significantly

    • using daily records for all measuring stations would skew the results toward the latter years because of the ever-increasing number of recording stations... much higher now than in 1880 (which should also increase the opportunity for recording a state high temperature record in the latter years).

      We see that for the 50 states x 365 days there are 18,250 opportunities to set a state daily record.

      Now, when you get down to the recording station level, the number of opportunities to set a daily record is thousands of times higher.


      "The Master Station History Report is a listing of the approximately 30,000 stations documented in the NCDC Station History Data Base. They are located on all continents but more than 95% are US sites."

      Let's see... that's 30,000 x .95 x 365 days or 10,402,500 opportunities to set a record each year. That would be around 86,000 new records per year on average... "normal"... if there were completely random records. And remember that many of those stations didn't exist in the 1930s.

      How about 200,000 per year for the global warming greater frequency? So a thousand or so reporting station records set on a hot day is really nothing unusual.

      But the database for individual reporting stations is "flakey" with multiple identifiers for single sites which means this exercise is futile or requires a lot of "data cleaning" to get to individual site averages.

  • the U.S. is too small to represent "global warming"
    • the U.S. weather is not a closed system; it is influenced from changes around the world
    • the U.S. may be a small part of the earth's surface if oceans are included, but it is a much larger part of the total land area
If anything, the approach I took in my analysis is biased toward showing record high temperatures in more recent years... something the IPCC predicts... but something that is not happening in the U.S.

..

Can"t Find It?

Use the SEARCH BLOG feature at the upper left. For example, try "Global Warming".

You can also use the "LABELS" below or at the end of each post to find related posts.

Blog Archive

Cost of Gasoline - Enter Your Zipcode or Click on Map

CO2 Cap and Trade

There is always an easy solution to every human problem—neat, plausible, and wrong.
Henry Louis Mencken (1880–1956)
“The Divine Afflatus,” A Mencken Chrestomathy, chapter 25, p. 443 (1949)
... and one could add "not all human problems really are."
It was beautiful and simple, as truly great swindles are.
- O. Henry
... The Government is on course for an embarrassing showdown with the European Union, business groups and environmental charities after refusing to guarantee that billions of pounds of revenue it stands to earn from carbon-permit trading will be spent on combating climate change.
The Independent (UK)

Tracking Interest Rates

Tracking Interest Rates

FEDERAL RESERVE & HOUSING

SEARCH BLOG: FEDERAL RESERVE for full versions... or use the Blog Archive pulldown menu.

February 3, 2006
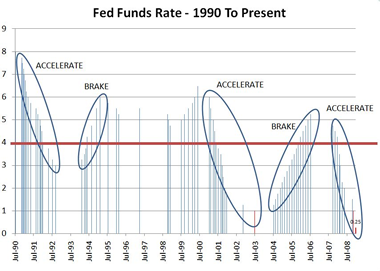
Go back to 1999-2000 and see what the Fed did. They are following the same pattern for 2005-06. If it ain't broke, the Fed will fix it... and good!
August 29, 2006 The Federal Reserve always acts on old information... and is the only cause of U.S. recessions.
December 5, 2006 Last spring I wrote about what I saw to be a sharp downturn in the economy in the "rustbelt" states, particularly Michigan.
March 28, 2007
The Federal Reserve sees no need to cut interest rates in the light of adverse recent economic data, Ben Bernanke said on Wednesday.
The Fed chairman said ”to date, the incoming data have supported the view that the current stance of policy is likely to foster sustainable economic growth and a gradual ebbing in core inflation”.

July 21, 2007 My guess is that if there is an interest rate change, a cut is more likely than an increase. The key variables to be watching at this point are real estate prices and the inventory of unsold homes.
August 11, 2007 I suspect that within 6 months the Federal Reserve will be forced to lower interest rates before housing becomes a black hole.
September 11, 2007 It only means that the overall process has flaws guaranteeing it will be slow in responding to changes in the economy... and tend to over-react as a result.
September 18, 2007 I think a 4% rate is really what is needed to turn the economy back on the right course. The rate may not get there, but more cuts will be needed with employment rates down and foreclosure rates up.
October 25, 2007 How long will it be before I will be able to write: "The Federal Reserve lowered its lending rate to 4% in response to the collapse of the U.S. housing market and massive numbers of foreclosures that threaten the banking and mortgage sectors."
November 28, 2007 FED VICE CHAIRMAN DONALD KOHN
"Should the elevated turbulence persist, it would increase the possibility of further tightening in financial conditions for households and businesses," he said.

"Uncertainties about the economic outlook are unusually high right now," he said. "These uncertainties require flexible and pragmatic policymaking -- nimble is the adjective I used a few weeks ago."
http://www.reuters.com/

December 11, 2007 Somehow the Fed misses the obvious.
fed_rate_moves_425_small.gif
[Image from: CNNMoney.com]
December 13, 2007 [from The Christian Science Monitor]
"The odds of a recession are now above 50 percent," says Mark Zandi, chief economist at Moody's Economy.com. "We are right on the edge of a recession in part because of the Fed's reluctance to reduce interest rates more aggressively." [see my comments of September 11]
January 7, 2008 The real problem now is that consumers can't rescue the economy and manufacturing, which is already weakening, will continue to weaken. We've gutted the forces that could avoid a downturn. The question is not whether there will be a recession, but can it be dampened sufficiently so that it is very short.
January 11, 2008 This is death by a thousand cuts.
January 13, 2008 [N.Y. Times]
“The question is not whether we will have a recession, but how deep and prolonged it will be,” said David Rosenberg, the chief North American economist at Merrill Lynch. “Even if the Fed’s moves are going to work, it will not show up until the later part of 2008 or 2009.
January 17, 2008 A few days ago, Anna Schwartz, nonagenarian economist, implicated the Federal Reserve as the cause of the present lending crisis [from the Telegraph - UK]:
The high priestess of US monetarism - a revered figure at the Fed - says the central bank is itself the chief cause of the credit bubble, and now seems stunned as the consequences of its own actions engulf the financial system. "The new group at the Fed is not equal to the problem that faces it," she says, daring to utter a thought that fellow critics mostly utter sotto voce.
January 22, 2008 The cut has become infected and a limb is in danger. Ben Bernanke is panicking and the Fed has its emergency triage team cutting rates... this time by 3/4%. ...

What should the Federal Reserve do now? Step back... and don't be so anxious to raise rates at the first sign of economic improvement.
Individuals and businesses need stability in their financial cost structures so that they can plan effectively and keep their ships afloat. Wildly fluctuating rates... regardless of what the absolute levels are... create problems. Either too much spending or too much fear. It's just not that difficult to comprehend. Why has it been so difficult for the Fed?

About Me

My photo
Michigan, United States
Air Force (SAC) captain 1968-72. Retired after 35 years of business and logistical planning, including running a small business. Two sons with advanced degrees; one with a business and pre-law degree. Beautiful wife who has put up with me for 4 decades. Education: B.A. (Sociology major; minors in philosopy, English literature, and German) M.S. Operations Management (like a mixture of an MBA with logistical planning)