Updating Statewide Monthly Temperature Extremes
SEARCH BLOG: CLIMATE
PLEASE SEE http://hallofrecord.blogspot.com/2009/01/where-is-global-warming-extreme_19.html FOR THE ACTUAL UPDATED MATERIAL
Now that 2008 records are available, I am updating the file Extreme Temperatures By State - Database and Analysis [Excel 2003 File] (and the Excel 2007 version). These files contained maximum temperature records through 2006 and minimum records through 2004. At the time of the last update, the minimum records were being reloaded into a new server and were not available.
So that you understand what this is about, a few years ago I was looking for evidence of global warming based on the assertion that such warming would be manifested by more extreme high temperatures. An analysis of our local temperatures revealed that most of the records occurred in the 1950s and 1980s, not in the last 20 years. That lead me to search for a more widespread sample... the U.S.
The U.S. analysis showed that the late 1990s were indeed hot and had a greater than normal expected level of statewide monthly records. What it also showed, however, was that the 1930s had a much higher frequency of those records. Finally, it showed a sharp tailing off of such extremes beginning with the new century.
I have completed the review of the high temperature extremes through 2008 and there were no additional statewide month high temperature records. An analysis of the 2005 - 2008 data for minimum temperature records will be started shortly. These analyses are done by going through the all-time daily records by location by state and comparing those to the all-time monthly records by state. The latter has a maximum of 600 records. If an old record is tied, the record is then attributed to the latest occurrence and the old occurrence is dropped.
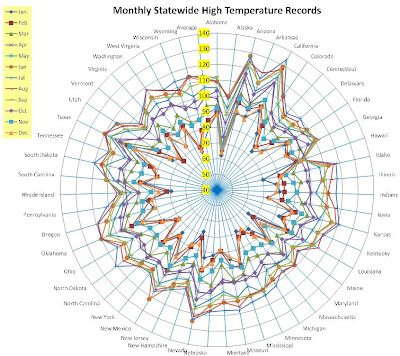
This is an image of the High Temperature records by state. The database provides more detail regarding when and where. You can use the image to compare with any new record announced to see if it actually represents a new record for the state and the month. Click image for larger view [you may also have to increase the browser's magnification ... CTRL+].
ADDENDUM
For the graphically oriented, here is a chart of all of the monthly, statewide, high-temperature records. Temperature axis is outside to center. Again, click to enlarge [you may also have to increase the browser's magnification ... CTRL+].
..


